1. Self-Monitor Practice
This passage is about the self-monitor practice of open source Open-Falcon in Xiaomi.
1.1. Introduction
We call the monitor for the monitor system itself the self-monitor of monitor system. The damand of self-monitor does not go beyond the obligation category of a monitor system. Like other systems, self-monitor is also responsible for error alert and state display. Error alert requires the system to spot out the error and inform the person in charge as soon as possible, which needs high availability. State display is mostly for the predition in advance and the investigation afterwards, so it requires a lower level of real-time character and availability. Next we are going to introduce the self-monitor in these two aspects.
1.2. Error Alert
Error alert in relatively easy. We use the third-party monitor module AntEye to monitor the health condition of Open-Falcon instance.
Each module of Open-Falcon provides a self-monitor port in the example delow that describes the the availability of its service. AntEye will regularly inspect and invoke the self-monitor port of each Open-Falcon instance. If they finds that sone ports does not return the "OK" message as promised, they will consider these ports are in malfunction and inform relevant person in charge via SMS or mail. AntEye uses some simple omission strategies and combines some alarms if appropriate to reduce the alarm frequency.
    # API for my availability
    Port URL
        /health check whether this service is still working

    Request Method
        GET http://$host:$port/health
        $host the machine name or IP where the serive is
        $port the http.server monitor port of the service

    Request Data
        nodata

    Returned Result(string)
        "OK"(the service is not working if "OK" is not returned)
AntEye actively pulls the state data and loads monitor instances, alarm recipients and alarm channel information through lcoal configuration file. The aim of this process is to simplify the alarm link as much as possible and to improve the character of real-time and stability while the system is tracking down the error. AntEye is a light and simple module written in a tiny amount of codes. Therefore, one AnyEye instance has high availability. Besides, AnyEye is stateless, which can be multi-deployed and that further guatantees the high availability of self-monitor service.
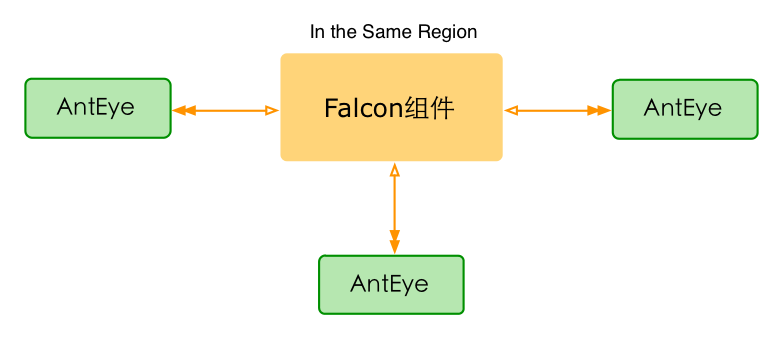
Usually, more than three AntEye are deployed in an important network region like in the picture below. We will not let AntEye monitor multiple regions because it will bring many false alarms in network level. One alarm may be sent several times when more than one AntEye are deployed. From the actual practice, we consider this situation acceptable as the price of high availability.
One thing to notice is that the feature of error tracking down is previously a code fragment in Task module of Open-Falcon. But for the need of multi-deployment, we removed the logic of error tracking down and referred to independent third-party monitor module AntEye.
1.3. State Display
State display means displaying all the state data of Open-Falcon module in diagrams for user's simplicity. Since this feature does not require the character of real-time and availability that much, we choose Open-Falcon to save and display its state data. So the rest of the work is the collection of data.
Most modules in Open-Falcon provides a port for querying the state of the service like:
    # API for querying my statistics
    Port URL
        /counter/all return all the state data

    Request Method
        GET http://$host:$port/counter/all
        $host the name or IP of the machine where the service is
        $port the http.server monitor port of the service

    Request Data
        nodata

    Returned Result
        // json format
        {
            "msg": "success", // "success" means the request is successfully processed and other message means failure
            "data":[ // the list of the state itself
                // every piece of state data includes the field of Name, Cnt and Time, may include the field of Qps
                {
                    "Name": "RecvCnt",
                    "Cnt": 6458396967,
                    "Qps": 81848,
                    "Time": "2015-08-19 15:52:08"
                },
                ...
            ]
        }
The Task Module of Open-Falcon regularly pulls the state data of all instances in Open-Falcon through the port mentioned above. And then it converts the data format to the one that is suitable for Open-Falcon. Finally it pushes the converted data to the local Agent before the local Agent transfers them to the Open-Falcon of the monitor system.
Task module defines the character of the collection of state data through the collector item in configuration file like:
    "collector":{
        "enable": true,
        "destUrl" : "http://127.0.0.1:1988/v1/push", // sending the converted state data to the local 1988 port (the receptor of Agent)
        "srcUrlFmt" : "http://%s/counter/all", // the format of the query port of state data, %s will be replaced with $hostname:$port in cluster configuration index
        "cluster" : [
            // "$module,$hostname:$port",means a $module service is associated with $hostname:$port
            // added to the configuration of "srcUrlFmt", the address of the port of querying state data is "http://test.host01:6060/counter/all" and so on
            "transfer,test.host01:6060",
            "graph,test.host01:6071",
            "task,test.host01:8001"
        ]
    }
When Task is converting the data, it sets the endpoint to the name of the machine $hostname where the data are from ($hostname is the name of one machine in Task's collection history of the configuration of collector.cluster), sets metric to $Name and $Name.Qps of the original data, sets tags to module=$module,port=$port,type=statistics,pdl=falcon ($module and $port are the module name and port in Task's collection history of the configuration of collector.cluster; the other two tags are automatically filled), sets the data type to GAUGE and sets the cycle to the data collection cycle of Task. The Task with the configuration above will be converted like this
    # The original state data from "transfer,test.host01:6060"
    {
        "Name": "RecvCnt",
        "Cnt": 6458396967,
        "Qps": 81848,
        "Time": "2015-08-19 15:52:08"
   }

    # After Task's conversion here are two pieces of monitor data
    {
        "endpoint": "test.host01", // the name of the machine in the configuration index "transfer,test.host01:6060" of the Task configuration collector.cluster
        "metric": "RecvCnt", // $Name in the original state data
        "value": 6458396967, // $Cnt in the original state data
        "type": "GAUGE",    // fixed to GAUGE
        "step": 60, // the cycle of Task's data collection, 60 seconds by default
        "tags": "module=transfer,port=6060,pdl=falcon,type=statistics", // the first two tags are corresponding with the name of tha module and the port in the configuration index "transfer,test.host01:6060" of Task's configuration collector.cluster and the last two tags are automatically filled with fixed value.
        ...
    },
    {
        "endpoint": "test.host01",
        "metric": "RecvCnt.Qps", // 原始状态数据中的$Name + ".Qps"
        "value": 81848, // 原始状态数据中的$Qps
        "type": "GAUGE",
        "step": 60,
        "tags": "module=transfer,port=6060,pdl=falcon,type=statistics",
        ...
    }
We can only push one copy of state data to Open-Falcon (because multiple copies have data overlapping that confuses the monitor process). Therefore, only one Task instance can be deployed in one network region. (Interregional deployment is not recommended.) Single deployment does have the issue of low availability. But AntEye will monitor the state of Task and track down the error. To some extent, it still can lower the risk of single deployment of state data collection service.
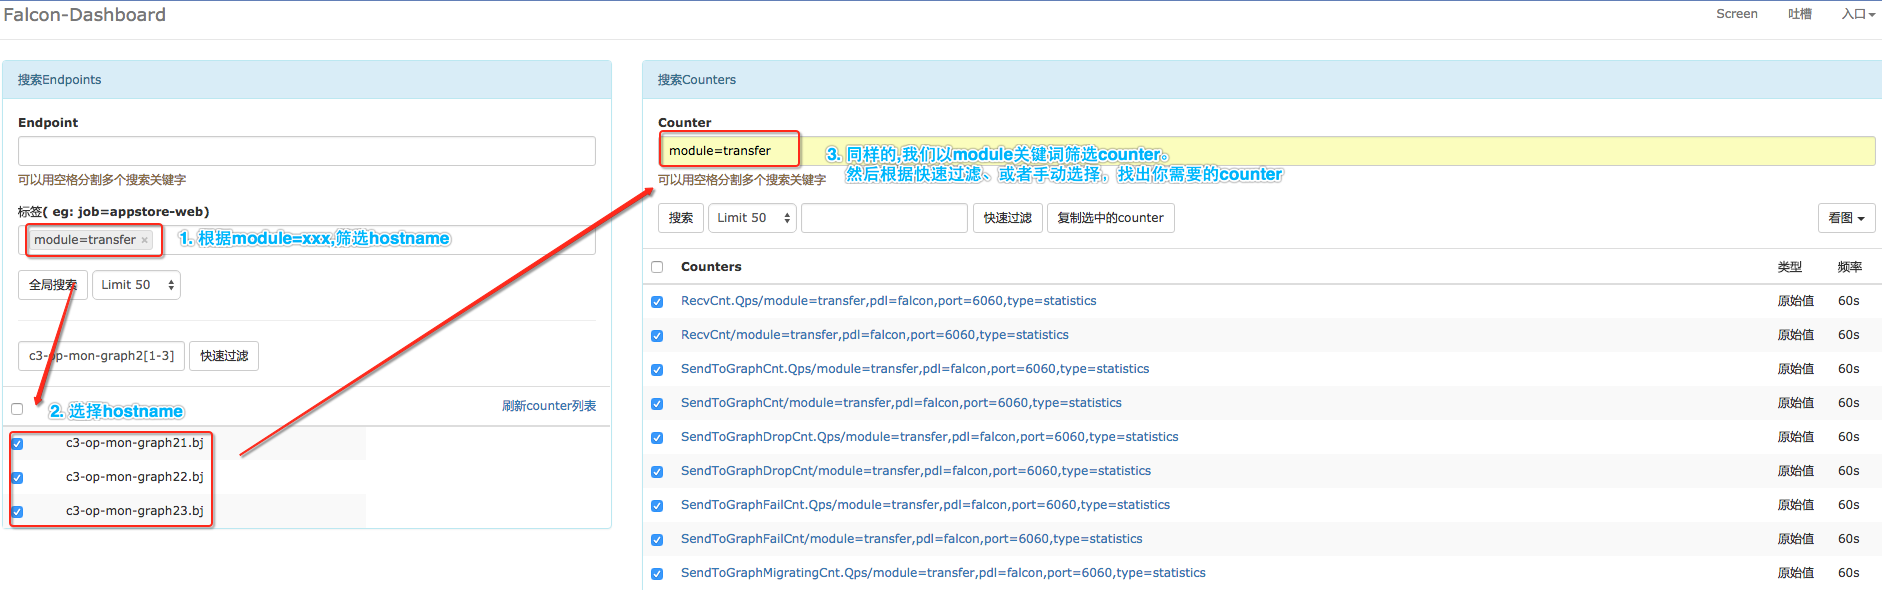
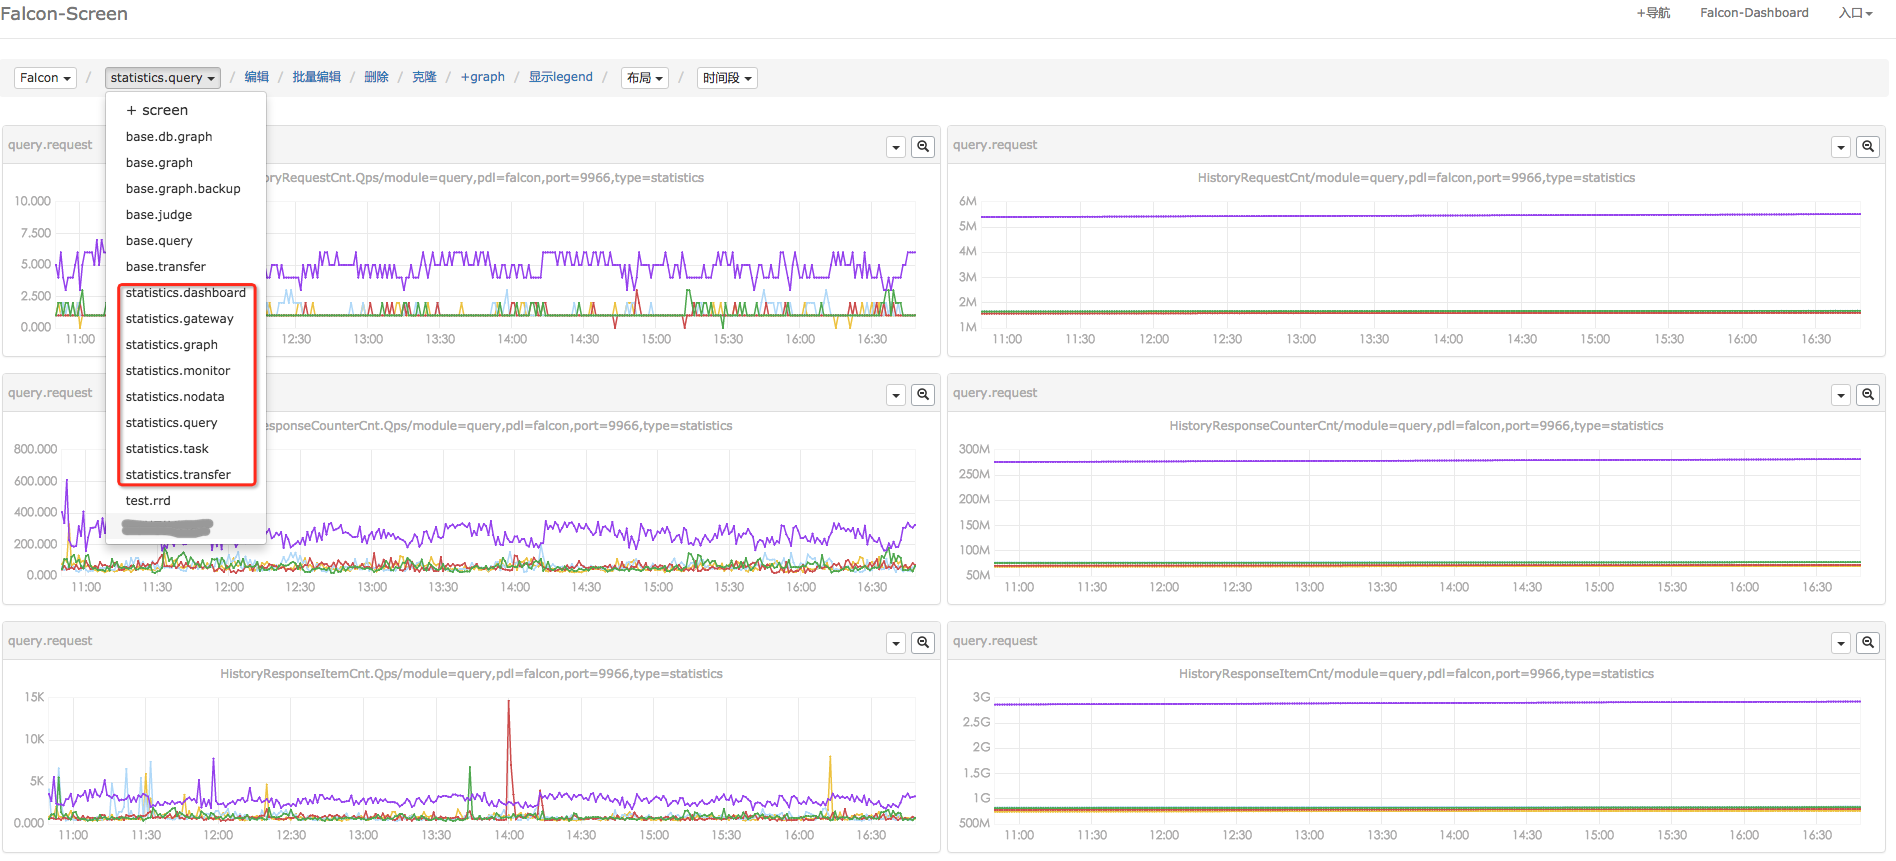
When the flow of state data reaches Open-Falcon, we can custimize the Screen page. The picture below is Xiaomi's page of state data statictis. When you are custimizing your page, you need to find the counter that concerns you by searching in the Dashboard, like in the picture below. Please visit Appendix for the self-monitor counter of different modules.
Filtering state index relevant to self-monitor
Customizing your own screen of self-monitor's state
The operation becomes much easier with the the screen of state and data of Open-Falcon It will only take 10 minutes to watch these curves before getting to work to spot out the occured issues and even predict the malfunation and evaluate the capacity.
1.4. Summary
Here is the summary of self-monitor。
An amazing doctor usually cannot save himself. A monitor system of big scale usually needs a third-party monitor system (AntEye) for大型监控系统的故障监控,往往需要借助第三方监控系统(AntEye)。The simpler and more indenpent a third-party monitor system is, the better it is.
Improve on itself. The more state data of a system are exposed, the easier to maintain it. We have tried our best to make the container of state data universal, make the port of receiving state data consistent, and make the collection service of state data centralized, which facilitates the inheritance and operation. Currently, the method of how a programm gathers its state data is still not perfect and severely hacked. We will be extremely grateful if you can give us some advice.
1.5. Appendix
1.5.1. 1. The State Index of Open-Falcon State
Here are some (not all) important state indexes od Open-Falcon and their meaning.
    #transfer                       meaning
    RecvCnt.Qps                     #Qps of receiving data
    GraphSendCacheCnt               #the length of cache data transferred to Graph
    SendToGraphCnt.Qps              #Qps of the data transferred to Graph
    SendToGraphDropCnt.Qps          #Qps of the data dropped out of the cache when transferred to Graph
    SendToGraphFailCnt.Qps          #Qps of the data failed to be sent when transferred to Graph
    JudgeSendCacheCnt               #the length of cache data transferred to Judge
    SendToJudgeCnt.Qps              #Qps of the data transferred to Judge
    SendToJudgeDropCnt.Qps          #Qps of the data dropped out of the cache when transferred to Judge
    SendToJudgeFailCnt.Qps          #Qps of the data failed to be sent when transferred to Judge
    #graph                          meaning
    GraphRpcRecvCnt.Qps             #Qps of receiving data
    GraphQueryCnt.Qps               #Qps of processing Query request
    GraphLastCnt.Qps                #Qps of processing Last request
    IndexedItemCacheCnt             #the number of index in cache, as known as the number of monitor index
    IndexUpdateAll                  #the time of index full update
    #query                          meaning
    HistoryRequestCnt.Qps           #Qps of history data query
    HistoryResponseItemCnt.Qps      #Qps of the points returned by history data query
    LastRequestCnt.Qps              #Qps of Last query request
    #task                           meaning
    CollectorCronCnt                #the time of state data collection in self-monitor
    IndexDeleteCnt                  #the time of removing junk index
    IndexUpdateCnt                  #the time of index full update
    #gateway                        meaning
    RecvCnt.Qps                     #Qps of receiving data
    SendCnt.Qps                     #Qps of sending data to Transfer
    SendDropCnt.Qps                 #Qps of the data dropped out of the cache when transferred to Transfer
    SendFailCnt.Qps                 #Qps of the data failed to be sent when transferred to Transfer
    SendQueuesCnt                   #the length of cache data transferred to Judge
    #anteye                         meaning
    MonitorCronCnt                  #the time of self-monitor system judging running state
    MonitorAlarmMailCnt             #the time of self-monitor system sending alarm mail
    MonitorAlarmSmsCnt              #the time of self-monitor system sending alarm SMS
    MonitorAlarmCallbackCnt         #the time of self-monitor system invoking callback
    #nodata                         meaning
    FloodRate                       #the percentage of nodata
    CollectorCronCnt                #the time of data collection
    JudgeCronCnt                    #the time of nodata judging
    NdConfigCronCnt                 #the time of the configuration of nodata being pulled
    SenderCnt.Qps                   #Qps of sending mock data