- MongoDB performance monitor plugin for Open-Falcon
- Supports
- The principle of collecting monitor data
- Required Environment
- Mongomon Deployment
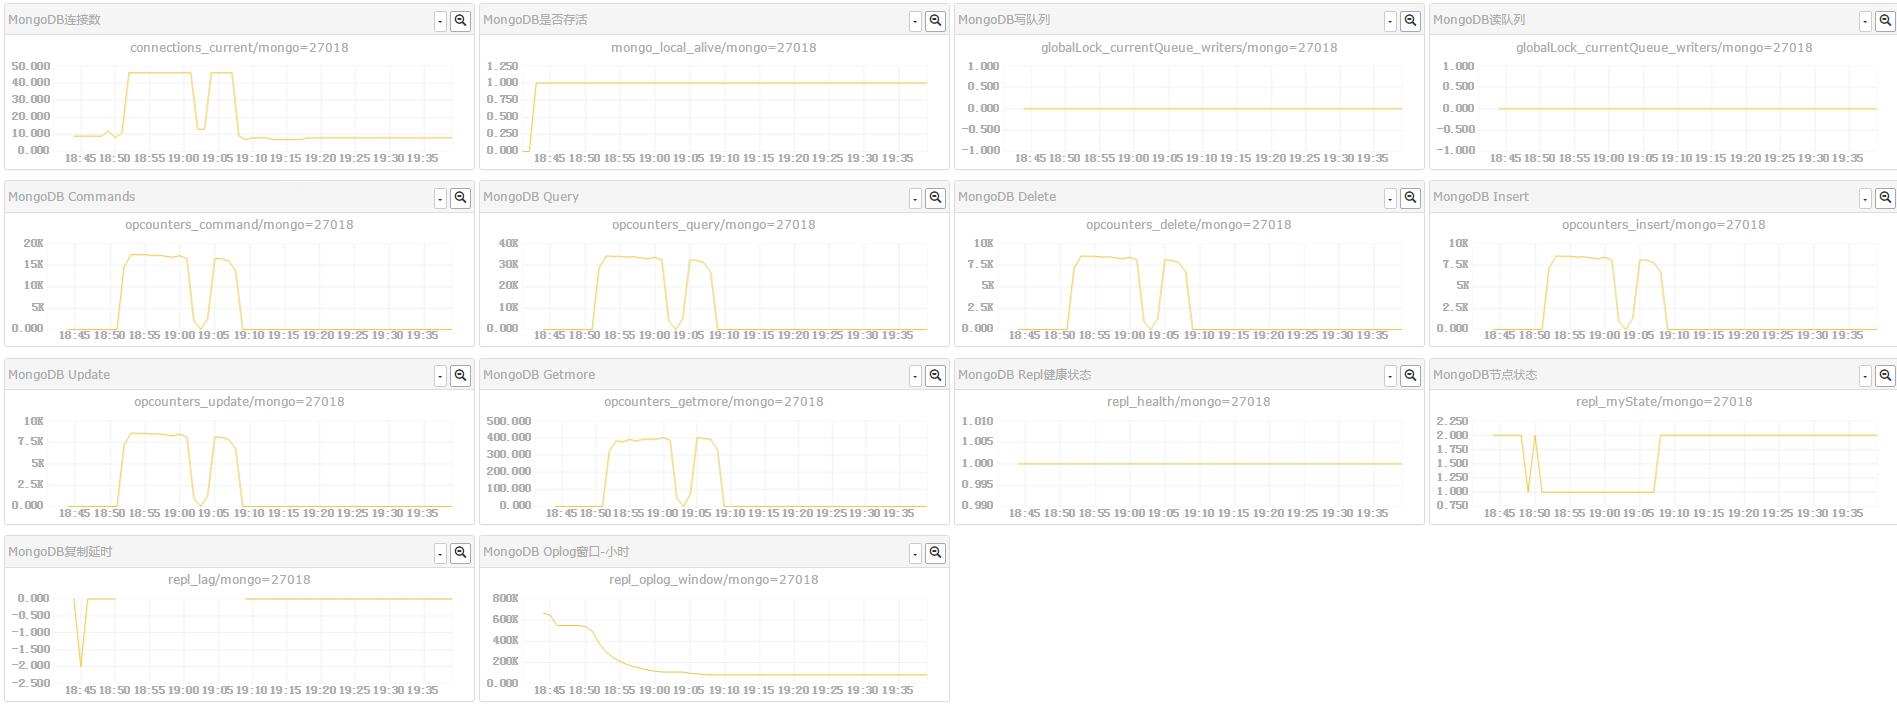
- MongoDB falcon screen
- Collected MongoDB Metrics
- Recomended Metrics of Monitor Alarm
- Note: The system-level monitor metrics are provided by falcon agent. The triggerring condition can be adjust according to actual situation.
- Contributors
1.1. MongoDB performance monitor plugin for Open-Falcon
1.2. Supports
Supported version: v2.4, v2.6, v3.0, v3.2 MongoDB and v3.0 Percona Mongo
Supported storage engine: MMAPv1, wiredTiger, RocksDB, PerconaFT (part of the storage engine has not been tested, which can be added right in the code)
Supported structure: standlone, replica set, sharded cluster
Supported node:mongod data node, configuration node,Primary/Secondary, mongos; Arbiter node is NOT supported
1.3. The principle of collecting monitor data
1 survival monitor: auth included
2 serverStatus
3 replSetGetStatus
4 oplog.rs
5 mongos
They are collected and sent by cron once a minute and the collection will not affect the performance of MongoDB.
1.4. Required Environment
Operation system: Linux
Python 2.6
PyYAML > 3.10
python-requests > 0.11
1.5. Mongomon Deployment
1 Unzip to /path/to/mongomon.
2 Configure the multi-instance information of the current server (mongod, nodes,mongos). Each line in /path/to/mongomon/conf/mongomon.conf records a instance in form of: port, username, password
- {port: 27017, user: "",password: ""}
3 Configure crontab, Change the installation path of mongomon in mongomon/conf/mongomon_cron; cp mongomon_cron /etc/cron.d/
4 After several minutes, user can check MongoDB metric in the Dashboard of Open-falcon.
5 Endpoint is hostname by default.
1.6. MongoDB falcon screen
1.7. Collected MongoDB Metrics
| Counters | Type | Notes |
|---|---|---|
| mongo_local_alive | GAUGE | local monitor of mongodb survival; if Auth is enable, it needs authentication success |
| asserts_msg | COUNTER | the number of assert message per second |
| asserts_regular | COUNTER | the number of regular assert per second |
| asserts_rollovers | COUNTER | the frequency of counter rollover in a second, which will be reset to zero by every 2^30 asserts |
| asserts_user | COUNTER | the number of user's assert per second |
| asserts_warning | COUNTER | the number of warning assert per second |
| page_faults | COUNTER | the number of page falut per second |
| connections_available | GAUGE | the number of available connection |
| connections_current | GAUGE | the number of all current client connection |
| connections_used_percent | GAUGE | the percentage pf used connection |
| connections_totalCreated | COUNTER | the number of newly created connection per second |
| globalLock_currentQueue_total | GAUGE | the number of operation waiting for a lock in the queue |
| globalLock_currentQueue_readers | GAUGE | the number of operation waiting for reading a lock in the queue |
| globalLock_currentQueue_writers | GAUGE | the number of operation waiting for writing a lock in the queue |
| locks_Global_acquireCount_ISlock | COUNTER | the number of intent share lock on instance-level |
| locks_Global_acquireCount_IXlock | COUNTER | the number of intent exclusive lock on instance-level |
| locks_Global_acquireCount_Slock | COUNTER | the number of share lock on instance-level |
| locks_Global_acquireCount_Xlock | COUNTER | the number of exclusive lock on instance-level |
| locks_Global_acquireWaitCount_ISlock | COUNTER | the wait number of intent share lock on instance-level |
| locks_Global_acquireWaitCount_IXlock | COUNTER | the wait number of intent exclusive lock on instance-level |
| locks_Global_timeAcquiringMicros_ISlock | COUNTER | the time consuming of share lock on instance-level measured in millisecond |
| locks_Global_timeAcquiringMicros_IXlock | COUNTER | the time consuming of exclusive lock on instance-level measured in millisecond |
| locks_Database_acquireCount_ISlock | COUNTER | the number of intent share lock on database-level |
| locks_Database_acquireCount_IXlock | COUNTER | the number of intent exclusive lock on database-level |
| locks_Database_acquireCount_Slock | COUNTER | the number of share lock on database-level |
| locks_Database_acquireCount_Xlock | COUNTER | the number of exclusive lock on database-level |
| locks_Collection_acquireCount_ISlock | COUNTER | the number of intent share lock on aggregation-level |
| locks_Collection_acquireCount_IXlock | COUNTER | the number of intent exclusive lock on aggregation-level |
| locks_Collection_acquireCount_Xlock | COUNTER | the number of exclusive lock on aggregation-level |
| opcounters_command | COUNTER | the number of all the commands database executes per second |
| opcounters_insert | COUNTER | the number of all the insertions database executes per second |
| opcounters_delete | COUNTER | the number of all the deletions database executes per second |
| opcounters_update | COUNTER | the number of all the updates database executes per second |
| opcounters_query | COUNTER | the number of all the queries database executes per second |
| opcounters_getmore | COUNTER | the number of all the getmores database executes per second |
| opcountersRepl_command | COUNTER | the number of all the duplicated commands database executes per second |
| opcountersRepl_insert | COUNTER | the number of all the duplicated insertions database executes per second |
| opcountersRepl_delete | COUNTER | the number of all the duplicated deletions database executes per second |
| opcountersRepl_update | COUNTER | the number of all the duplicated updates database executes per second |
| opcountersRepl_query | COUNTER | the number of all the duplicated queries database executes per second |
| opcountersRepl_getmore | COUNTER | the number of all the duplicated getmores database executes per second |
| network_bytesIn | COUNTER | the number of byte database receives during network transmission per second |
| network_bytesOut | COUNTER | the number of byte database sends during network transmission per second |
| network_numRequests | COUNTER | the number of request database receives per second |
| mem_virtual | GAUGE | virtual memory database uses |
| mem_resident | GAUGE | physical memory database uses |
| mem_mapped | GAUGE | mapped memory (only in MMAPv1 storage engine) |
| mem_bits | GAUGE | 64 or 32bit |
| mem_mappedWithJournal | GAUGE | mapped memory the log of journal consumes (only in MMAPv1 storage engine) |
| backgroundFlushing_flushes | COUNTER | the number of flush database executes in disk per second |
| backgroundFlushing_average_ms | GAUGE | the average time consuming of flush database executes in disk measured in millisecond |
| backgroundFlushing_last_ms | COUNTER | the time consuming of latest flush database executes in disk measured in millisecond |
| backgroundFlushing_total_ms | GAUGE | the total time consuming of flush database executes in disk measured in millisecond |
| cursor_open_total | GAUGE | the total number of cursor the current data maintains for client |
| cursor_timedOut | COUNTER | the number of cursor that has timeout in the connection with database per second |
| cursor_open_noTimeout | GAUGE | the number of cursor in DBQuery.Option.noTimeout configuration |
| cursor_open_pinned | GAUGE | the number of opened pinned cursor |
| repl_health | GAUGE | the replica of health condition |
| repl_myState | GAUGE | the replica set state of current node |
| repl_oplog_window | GAUGE | the size of oplog window |
| repl_optime | GAUGE | the timestamp of last execution |
| replication_lag_percent | GAUGE | the lag rate |
| repl_lag | GAUGE | the lag of Secondary replica measured in second |
| shards_size | GAUGE | the number of shard in the database cluster; config.shards.count |
| shards_mongosSize | GAUGE | the number of mongos node in database cluster;config.mongos.count |
| shards_chunkSize | GAUGE | the size of chunk in database cluster, requiring from the aggregation config.settings |
| shards_activeWindow | GAUGE | whether the data equalizer in database cluster has time window, 1/0 |
| shards_activeWindow_start | GAUGE | the starting time of time window of the data equalizer in database cluster, the format 23.30 means 23:30 |
| shards_activeWindow_stop | GAUGE | the ending time of time window of the data equalizer in database cluster, the format 23.30 means 23:30 |
| shards_BalancerState | GAUGE | whether the data equalizer in database cluster is enabled, 1/0 |
| shards_isBalancerRunning | GAUGE | whether the data equalizer in database cluster is in block migration, 1/0 |
| wt_cache_used_total_bytes | GAUGE | the byte number of wiredTiger cache |
| wt_cache_dirty_bytes | GAUGE | the byte number of "dirty " data in wiredTiger cache |
| wt_cache_readinto_bytes | COUNTER | the byte number database writes in wiredTiger cache per second |
| wt_cache_writtenfrom_bytes | COUNTER | the byte number database writes from wiredTiger cache to disk per second |
| wt_concurrentTransactions_write | GAUGE | write tickets available to the WiredTiger storage engine |
| wt_concurrentTransactions_read | GAUGE | read tickets available to the WiredTiger storage engine |
| wt_bm_bytes_read | COUNTER | the byte number block-manager reads per second |
| wt_bm_bytes_written | COUNTER | the byte number block-manager writes per second |
| wt_bm_blocks_read | COUNTER | the block number block-manager reads per second |
| wt_bm_blocks_written | COUNTER | the block number block-manager writes per second |
| rocksdb_num_immutable_mem_table | ||
| rocksdb_mem_table_flush_pending | ||
| rocksdb_compaction_pending | ||
| rocksdb_background_errors | ||
| rocksdb_num_entries_active_mem_table | ||
| rocksdb_num_entries_imm_mem_tables | ||
| rocksdb_num_snapshots | ||
| rocksdb_oldest_snapshot_time | ||
| rocksdb_num_live_versions | ||
| rocksdb_total_live_recovery_units | ||
| PerconaFT_cachetable_size_current | ||
| PerconaFT_cachetable_size_limit | ||
| PerconaFT_cachetable_size_writing | ||
| PerconaFT_checkpoint_count | ||
| PerconaFT_checkpoint_time | ||
| PerconaFT_checkpoint_write_leaf_bytes_compressed | ||
| PerconaFT_checkpoint_write_leaf_bytes_uncompressed | ||
| PerconaFT_checkpoint_write_leaf_count | ||
| PerconaFT_checkpoint_write_leaf_time | ||
| PerconaFT_checkpoint_write_nonleaf_bytes_compressed | ||
| PerconaFT_checkpoint_write_nonleaf_bytes_uncompressed | ||
| PerconaFT_checkpoint_write_nonleaf_count | ||
| PerconaFT_checkpoint_write_nonleaf_time | ||
| PerconaFT_compressionRatio_leaf | ||
| PerconaFT_compressionRatio_nonleaf | ||
| PerconaFT_compressionRatio_overall | ||
| PerconaFT_fsync_count | ||
| PerconaFT_fsync_time | ||
| PerconaFT_log_bytes | ||
| PerconaFT_log_count | ||
| PerconaFT_log_time | ||
| PerconaFT_serializeTime_leaf_compress | ||
| PerconaFT_serializeTime_leaf_decompress | ||
| PerconaFT_serializeTime_leaf_deserialize | ||
| PerconaFT_serializeTime_leaf_serialize | ||
| PerconaFT_serializeTime_nonleaf_compress | ||
| PerconaFT_serializeTime_nonleaf_decompress | ||
| PerconaFT_serializeTime_nonleaf_deserialize | ||
| PerconaFT_serializeTime_nonleaf_serialize |
1.8. Recomended Metrics of Monitor Alarm
1.9. Note: The system-level monitor metrics are provided by falcon agent. The triggerring condition can be adjust according to actual situation.
| Alarm Metric |
|---|
| load.1min>10 |
| cpu.idle<10 |
| df.bytes.free.percent<30 |
| df.bytes.free.percent<10 |
| mem.memfree.percent<20 |
| mem.memfree.percent<10 |
| mem.memfree.percent<5 |
| mem.swapfree.percent<50 |
| mem.memused.percent>=50 |
| mem.memused.percent>=10 |
| net.if.out.bytes>94371840 |
| net.if.in.bytes>94371840 |
| disk.io.util>90 |
| mongo_local_alive=0 |
| page_faults>100 |
| connections_current>5000 |
| connections_used_percent>60 |
| connections_used_percent>80 |
| connections_totalCreated>1000 |
| globalLock_currentQueue_total>10 |
| globalLock_currentQueue_readers>10 |
| globalLock_currentQueue_writers>10 |
| opcounters_command |
| opcounters_insert |
| opcounters_delete |
| opcounters_update |
| opcounters_query |
| opcounters_getmore |
| opcountersRepl_command |
| opcountersRepl_insert |
| opcountersRepl_delete |
| opcountersRepl_update |
| opcountersRepl_query |
| opcountersRepl_getmore |
| network_bytesIn |
| network_bytesOut |
| network_numRequests |
| repl_health=0 |
| repl_myState not 1/2/7 |
| repl_oplog_window<168 |
| repl_oplog_window<48 |
| replication_lag_percent>50 |
| repl_lag>60 |
| repl_lag>300 |
| shards_mongosSize |
1.10. Contributors
- Rulin Zhuo: mail:zhuorulintec@163.com; weibo: http://weibo.com/u/2540962412