1.1. Vsphere Monitor
In Data Collection, we introduced the common data sources. As a monitor framework, Open-Falcon can collect the monitor index data of any system as long as they are converted to the standard format of Open-Falcon.
The running data collection of vsphere, like Esxi, datastore, vm and etc., can be done through a script and sent to Open-Falcon.
The monitor data collection of vsphere cluster can be done through vsphere-monitor.
工作原理
Vsphere-monitor collects the data of vsphere cluster through pyvmomi. It can collect monitor data like ESXi,datastore,vm as long as it is connected to vcenter. The data is sent to Open-Falcon through the data port of Open-Falcon.
Required Version
python 2.7
Reported Data Field
| metric | tag | type | note |
|---|---|---|---|
| datastore.capacity | datacetner=datacenter,datastore=datastore,type=type | GAUGE | used disk space |
| datastore.free | datacetner=datacenter,datastore=datastore,type=type | GAUGE | available disk space |
| datastore.freePercent | datacetner=datacenter,datastore=datastore,type=type | GAUGE | percentage of available disk space |
| esxi.alive | datacetner=datacenter,cluster_name=cluster_name,host=host | GAUGE | esxi 1 means surviving; can be used in Nodata |
| esxi.net.if.in | datacetner=datacenter,cluster_name=cluster_name,host=host | GAUGE | esxi incoming network data (of all the network cards) |
| esxi.net.if.out | datacetner=datacenter,cluster_name=cluster_name,host=host | GAUGE | esxi outgoing network data (of all the network cards) |
| esxi.memory.freePercent | datacetner=datacenter,cluster_name=cluster_name,host=host | GAUGE | esxi percentage of available memory |
| esxi.memory.usage | datacetner=datacenter,cluster_name=cluster_name,host=host | GAUGE | esxi used memory |
| esxi.memory.capacity | datacetner=datacenter,cluster_name=cluster_name,host=host | GAUGE | esxi total memory |
| esxi.cpu.usage | datacetner=datacenter,cluster_name=cluster_name,host=host | GAUGE | esxi percentage of used CPU |
| esxi.uptime | datacetner=datacenter,cluster_name=cluster_name,host=host | GAUGE | esxi uptime |
| vm.power | vm=vm_name | GAUGE | whether the virtual machine is on; 1 means on and 0 means off; can be used in Nodata |
| vm.net.if.in | vm=vm_name | GAUGE | incoming network data of virtual machine (of all the network cards) |
| vm.net.if.out | vm=vm_name | GAUGE | outgoing network data of virtual machine (of all the network cards) |
| vm.datastore.io.write_latency | vm=vm_name | GAUGE | latency in writing of virtual machine storageio |
| vm.datastore.io.read_latency | vm=vm_name | GAUGE | latency in reading of virtual machine storageio |
| vm.datastore.io.write_numbers | vm=vm_name | GAUGE | IOPS in writing of virtual machine storage |
| vm.datastore.io.read_numbers | vm=vm_name | GAUGE | IOPS in reading of virtual machine storage |
| vm.datastore.io.write_bytes | vm=vm_name | GAUGE | data size of writing in virtual machine storage |
| vm.datastore.io.read_bytes | vm=vm_name | GAUGE | data size of reading in virtual machine storage |
| vm.memory.freePercent | vm=vm_name | GAUGE | percentage of available memory in virtual machien |
| vm.memory.usage | vm=vm_name | GAUGE | used memory in virtial machine |
| vm.memory.capacity | vm=vm_name | GAUGE | total memory in virtual machine |
| vm.cpu.usage | vm=vm_name | GAUGE | used CPU of virtual machine |
| vm.uptime | vm=vm_name | GAUGE | virtual machine uptime |
Installation
Get the code
git clone https://github.com/freedomkk-qfeng/vsphere-monitor.git
Install dependency
yum install -y python-virtualenv
cd vsphere-monitor
virtualenv ./env
./env/bin/pip install -r requirement.txt
Configuration
Edit the configuration file config.py
# falcon
endpoint = "vcenter" # endpoint reported to open-falcon 的 endpoint
push_api = "http://127.0.0.1:6060/api/push" # reported http api port
interval = 60 # time interval of reporting

# vcenter
host = "vcenter.host" # address of vcenter
user = "administrator@vsphere.local" # username of vcenter
pwd = "password" # password of vcenter
port = 443 # port of vcenter

# esxi
esxi_names = [] # esxi that needs to be collected; collect all if is null

# datastore
datastore_names = [] # datastore that needs to be collected; collect all if is null

# vm
vm_enable = True # whether to collect the information of virtual machine or not
vm_names = [     # virtual machine that needs to be collected; collect all if is null
            "vm1",
            "vm2",
            "vm3"
           ]
Execution
Try to execute at first. Assume vsphere-monitor is under /opt:
/opt/vsphere-monitor/env/bin/python /opt/vsphere-monitor/vsphere-monitor.py
Add it to the timed task if there is no problem.
crontab -e
0-59/1 * * * * /opt/vsphere-monitor/env/bin/python /opt/vsphere-monitor/vsphere-monitor.py
Issue
Part of the virtual machiens cannot collect vm.net.if.in and vm.net.if.out metric. This is because the metric about network is collected through PerformanceManager of vsphere. When you view the performance diagram of a virtual machine in vcenter, you will also find the error as 未指定衡量指标 or No Metric Specified. This is a bug in vmware and it is fixed after vSphere 6.0 Update 1.
For detailed information, please refer to the official Knowledge at The Error "No Metric Specified (2125021)" occurs while viewing the performance diagram of a virtual machine in VMware vSphere Client 6.0 .
Screenshot
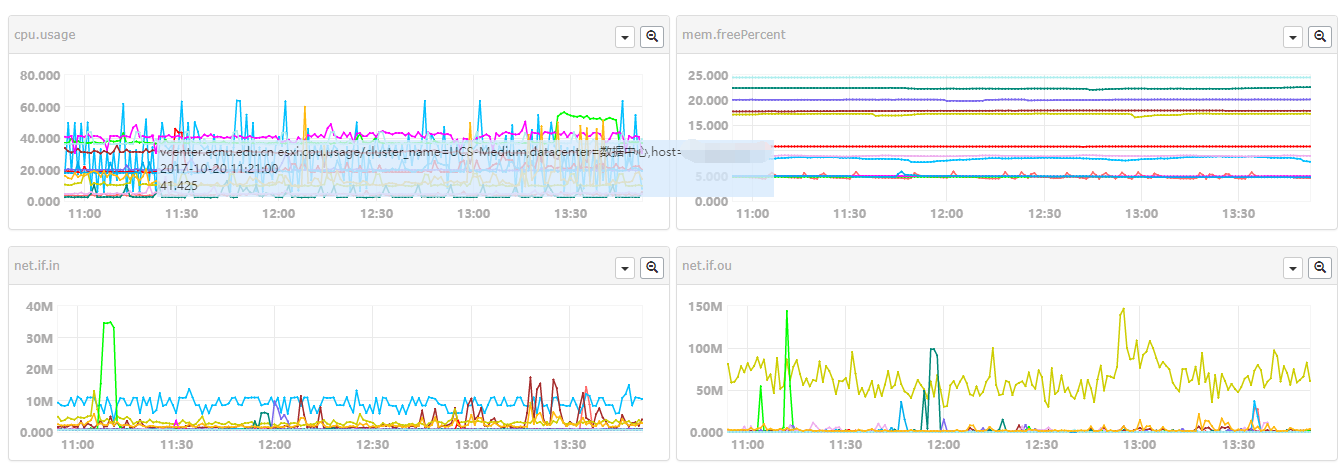
esxi
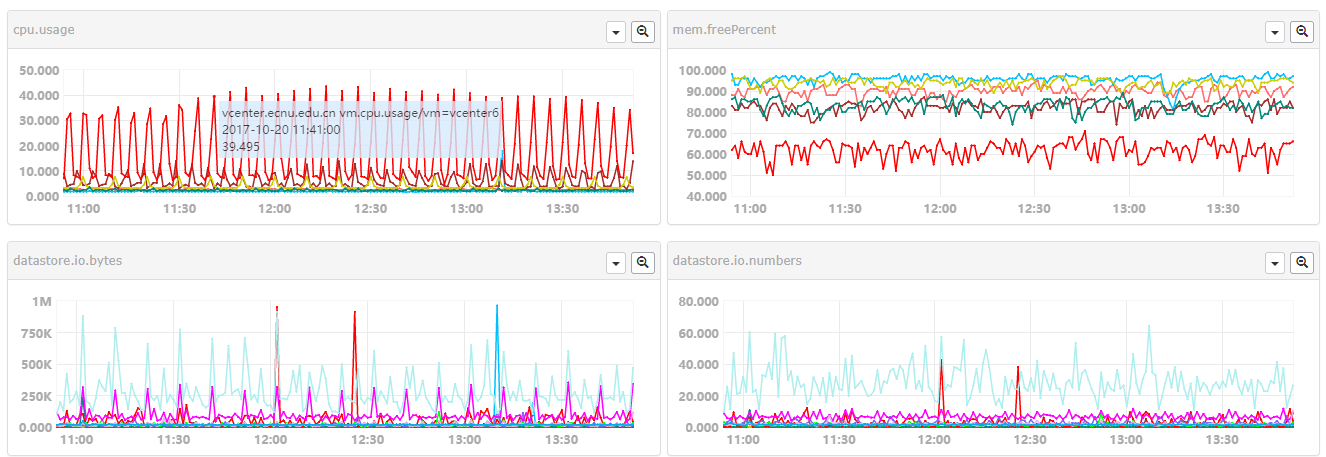
 vm
vm